![]()
Utility Peak Day Performance
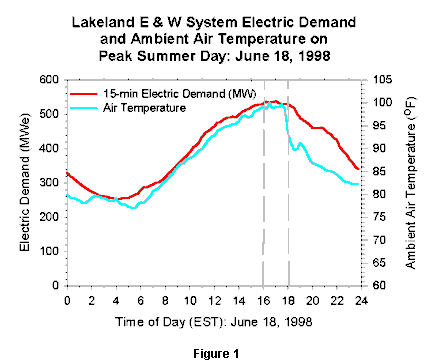
On June 18, 1998, Lakeland Electric and Water experienced their maximum annual utility summer peak for the summer. They recorded a record one-minute demand of 578 MW at 5:03 PM. Figure 1 shows the correspondance between the ambient air temperature measured at the Lakeland test site and the recorded average 15-minute electric demand for Lakeland Electric and Water (thanks to Al Lukhaub). So, just how did the occupied PVRES and vacant Control homes fare during this heat wave?
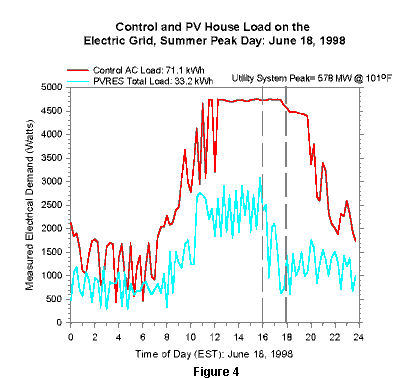
Performance on the utility peak day was impressive. Maximum recorded ambient air temperature was 101oF (a record) with bright sunny conditions. Figure 2 shows that the Control home used 71 kWh on this day-- with the 4-ton air conditioner running constantly between 11 AM and 6 PM. Meanwhile, the 2-ton AC in the PVRES home only runs constantly for the one hour from 11 AM to noon while it pre-cools the building from 76o to 74o. During the utility peak two hour period it runs less than half the time (908 W) with a demand difference between the homes of 3.82 kW.
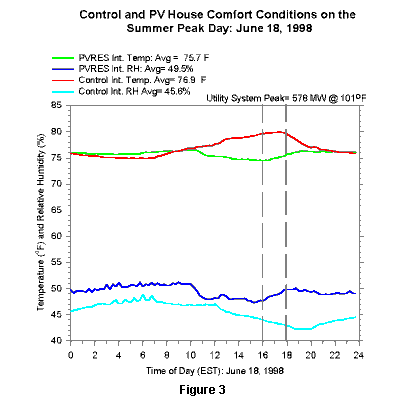
Interior comfort conditions, shown in Figure 3 show that the PVRES home was also better able to maintain space conditions. Running constantly from 11 AM onward, the Control home AC is unable to maintain interior temperature conditions at its 76o set point. The recorded interior temperature slowly rose to a maximum of 79.9oF. Meanwhile, the PVRES home easily maintained 74oF during this period. Both the Control and PVRES homes were able to maintain interior relative humidity below 50% during the daytime period.
The PVRES home was occupied on the peak day while the Control home is not. Even though not comparable, Figure 4 shows that the daily total electricity consumption (33 kWh) in the PVRES home was less than half the air conditioning load alone at the Control. Non-cooling loads at the PVRES home, consisting mainly of refrigeration, lighting and plug loads, totaled 13 kWh or about 40% of total consumption.
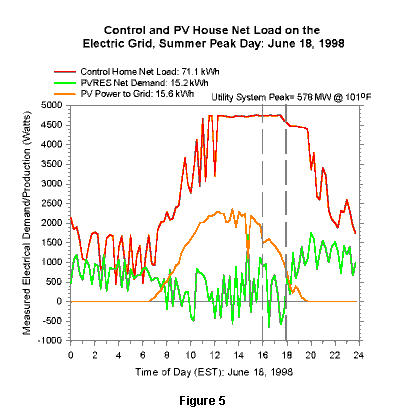
Figure 5 shows how solar photovoltaic (PV) power production affects the peak day picture. PV electrical generation sent to the grid totaled 15.6 kWh. Net energy demand of the home (Total Load - PV power) shows that most of the Net PVRES electricity use (15.2 kWh) occurred during the evening hours. PVRES net demand during the two hour utility peak coincident period varied around zero with power used during some periods and sent back to the grid during others. Average peak period PVRES net demand was 225 Watts with a measured average difference against AC use in the Control of 4.5 kW-- a peak demand reduction of 95%.
The results from the project during June's extreme heat wave show that we have met the design objective of the PVRES home: it is possible to build very efficient homes in Florida with PV which exert no net demand on the grid during utility coincident peak periods. Reduction in AC use was over 70% even with the PVRES home occupied and the Control unoccupied. When solar electric power production was included, the PVRES home had a net electric demand on the grid near zero.


