

![]()
Lighting
 Currently lighting represents about 13 % of the total annual
energy consumption for Florida schools (Sherwin and Parker 1996). This does
not take into account the heat produced by lighting. Lights increase the
sensible AC load by an average of 23% annually (Floyd et al. 1995). Schools
typically have T12 lamps with magnetic ballasts in classrooms because they
are the most inexpensive. However, it has been shown in previous studies
(Sherwin and Parker 1996, Parker et al. 1996a, McIlvaine et al. 1994) that
slim-line T8 lamps with electronic ballasts performed best in both commercial
buildings and educational facilities. Four-tube fixtures with T12s and magnetic
ballasts consume 155-180 W compared with 122 W for T8s with electronic ballasts.
These T8s combined with electronic ballasts consume less energy, are brighter
than T12s (109 decalux for T12s and 158 decalux for T8s), and run cooler
(McIlvaine et al. 1994).
Currently lighting represents about 13 % of the total annual
energy consumption for Florida schools (Sherwin and Parker 1996). This does
not take into account the heat produced by lighting. Lights increase the
sensible AC load by an average of 23% annually (Floyd et al. 1995). Schools
typically have T12 lamps with magnetic ballasts in classrooms because they
are the most inexpensive. However, it has been shown in previous studies
(Sherwin and Parker 1996, Parker et al. 1996a, McIlvaine et al. 1994) that
slim-line T8 lamps with electronic ballasts performed best in both commercial
buildings and educational facilities. Four-tube fixtures with T12s and magnetic
ballasts consume 155-180 W compared with 122 W for T8s with electronic ballasts.
These T8s combined with electronic ballasts consume less energy, are brighter
than T12s (109 decalux for T12s and 158 decalux for T8s), and run cooler
(McIlvaine et al. 1994).
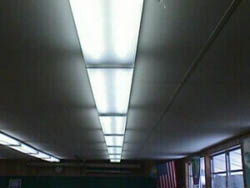
This is the concept behind retrofitting the lighting system
in portable 035. 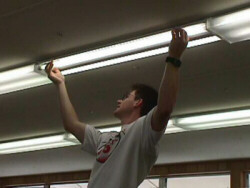 There are 24 fixtures in the portable and on May 21,
1998 the old magnetic ballasts (2 lamps per ballast) were replaced with 12
electronic ballasts (4 lamps per ballast). The T12 lamps were then replaced
when T8s.
There are 24 fixtures in the portable and on May 21,
1998 the old magnetic ballasts (2 lamps per ballast) were replaced with 12
electronic ballasts (4 lamps per ballast). The T12 lamps were then replaced
when T8s.
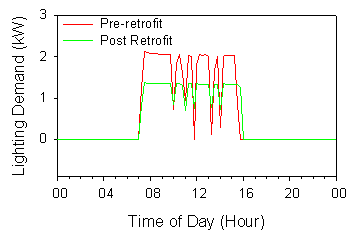
Below is a graph showing the lighting demand over the course of the
day for portable 035. The pre-retrofit average lighting demand is 0.60
kW while the post retrofit average lighting demand is 0.45 kW.
The lighting energy comparison pre- and post retrofit in this figure highlights the energy savings. The average energy demand on May 20, 1998 prior to the retrofit is 0.60 kW while the average energy demand after the retrofit (May 27, 1998) is 0.45 kW. This represents a energy savings of 25%, which is higher than in previous studies (Sherwin and Parker 1996). This savings is considerable since the data shows that lighting energy for portable 035 is 26% for May 20 while on May 27 the energy use was only 19% of total portable energy use.
© 2007-2014 University of Central Florida. The Florida Solar Energy Center (FSEC)
is a research institute of the
University of Central Florida.
For more information about FSEC, please contact us or learn more about us.
Find us on Facebook!