

![]()
Energy Related Performance of New York
Portable Performance Enhanced Relocatable Classrooms: PERC
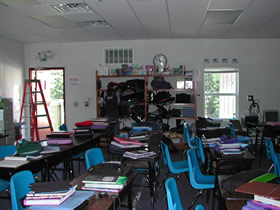
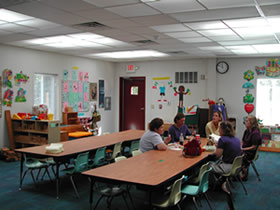
A series of plots below summarize the measured performance of the Control and Experimental PERC portable classrooms over the school year from 2002 -2003. As shown in Figure 1, the portables are located side-by-side at Cornwall Elementary School in Cornwall New York.
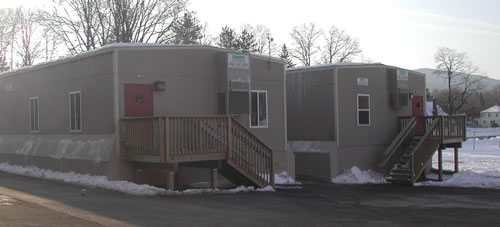
Figure 1. Side-by-side relocatable classrooms
Figure 2 shows a pie chart revealing how energy was used in the Control portable classroom over the year; Figure 3 shows the same data for the PERC portable revealing a 36% energy savings. The clear message of of the data is that energy use in portable classrooms is dominated by heating, cooling and ventilation. Lighting consumption is very much a secondary issue and other end-uses are virtually unimportant.
 |
 |
|
Figure 2. Control Portable
Energy Use 2002 - 2003 |
Figure 3. Experimental PERC portable Energy
Use 2002 - 2003 |
Figure 4 shows the average shape of the energy savings over the entire school year over a 24 hour cycle from November 2002 - June 20th of 2003. The measured overall energy savings of the more energy efficient experimental model was 48 kWh/day or 36%. Most of the savings were concentrated in the evening and early morning hours when the heating system was operating at its maximum. Note that the average peak electrical demand of the experimental unit at 8 AM is more than 2 kW (20%) lower than the control. The slightly greater demand around 4 PM is due to a difference in the lighting controls systems as documented below.
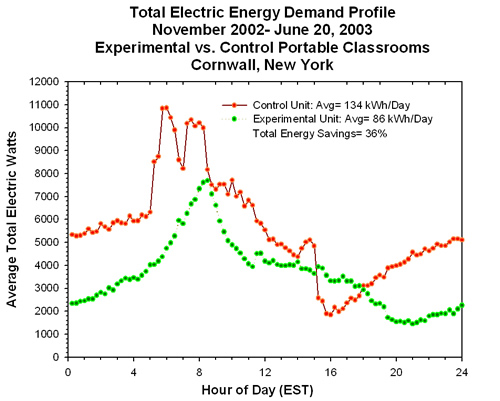
Figure 4. School year energy savings over a 24 hour cycle
Figure 5 shows how the HVAC savings varied over the winter months. Savings from November - March averaged 47% even with a difficult to resolve problem with the control thermostat in the PERC portable. This occurred when the system would refuse to turn off the HVAC system during unoccupied periods and would maintain abnormally high temperatures. A series of trial and errorprocedures were used to isolate the problem with eventually turned out to be a thermostat compatibility issue with the automated (CS-2000) control system. This was only resolved near the end of the project; savings would be considerably higher in a second year of monitoring. Regardless, the success in resolving this annoying problem should be reflected in more successful projects in North Carolina and Orlando.
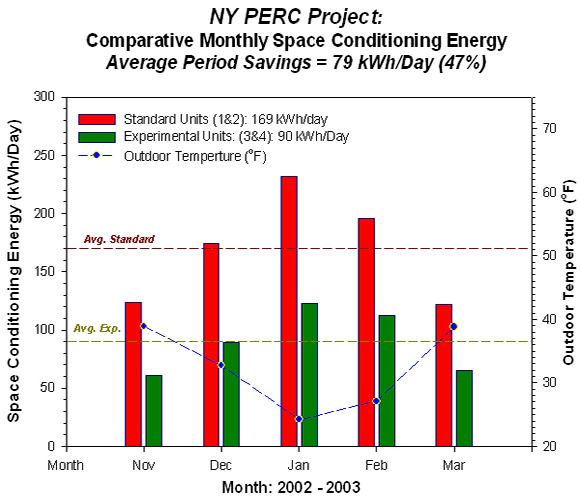
Figure 5. HVAC savings over the winter months
Figure 6 shows the same type of electric demand profile for the heating, ventilation and cooling system over the school year. Note the striking similarity of the load shape with the total electric load shape– indicating that energy use in portable classrooms is dominated by heating and cooling. The experimental unit has better insulation, windows and also a heat pump rather than electric resistance. Figure 7 shows the external HVAC system and the project weather tower. The daily average energy savings was 47 kWh or about 40%. As befits a heating dominated climate, the electric savings are concentrated during the morning warm up period and during nighttime when the better insulated classroom more easily maintains the minimum acceptable temperatures.
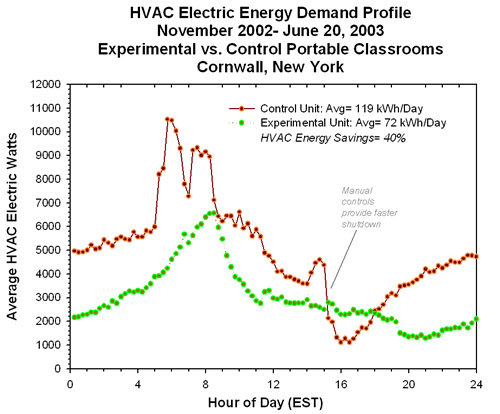
Figure 6. Electric demand profile for HVAC over school year
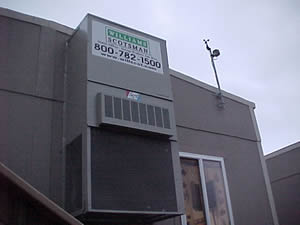
Figure 7. External HVAC system and weather tower
Figure 8 shows the lighting demand profile evaluated over the year. This comparison was disappointing as the experimental unit had a lower installed level of lighting inside, as well as the theoretically more efficient daylighting system. What was not counted upon, however, was that the teacher in one of the classrooms in the control portable would only turn on half of their lighting. Also, due to troubles with the vendor, we never achieved satisfactory daylighting responsive controls in the experimental unit. Even so, we showed about an 8% lower average daily lighting use (1.2 kWh/day) in the experimental unit– largely due to lower lighting during evening hours due to the occupancy based controls in the experimental unit. On the other hand, the occupancy controls actually increase lighting use around 3-4 PM after school is out. This seemingly contradictory result comes from the presence of teaching and janitorial staff keeping the lighting on due to occupancy sensing in the experimental unit, where as the lights are manually turned off in the control classrooms. Finally, the trouble with the stepped dimming control has emphasized the need to make certain that daylight dimming controls operate from the outset in our future projects.
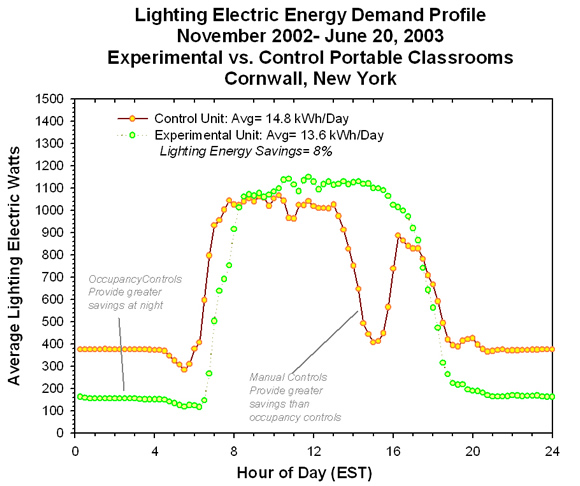
Figure 8. Lighting demand profile evaluated over the year
Beyond energy savings, however, the interior lighting quality was significantly improved. This is visually demonstrated as seen in Figure 9 and 10, comparing the control lighting with lights off, versus that the PERC unit. FSEC also enhanced the light quality of the NY PERC by retrofitting a sheet like enclosure around the skylight’s wells. This took place within the attic plenum to contain the natural light and help distribute it into the classroom space. This proved to have 10-15% increased light levels after the installation of the well material.
 |
 |
|
Figure 9. Control unit with electric lighting off |
Figure 10. Experimental unit with electric lighting off |
Both classrooms have small demand water heaters in the bathrooms of either classroom. Figure 11 shows the average measured water heating energy use. Although, bathroom energy use is very small portion of the overall total, the kindergarten classroom actually uses about twice as much energy (0.4 vs. 0.2 kWh/day.). However, this is a very small energy end-use that is less than half a percent of total energy use).
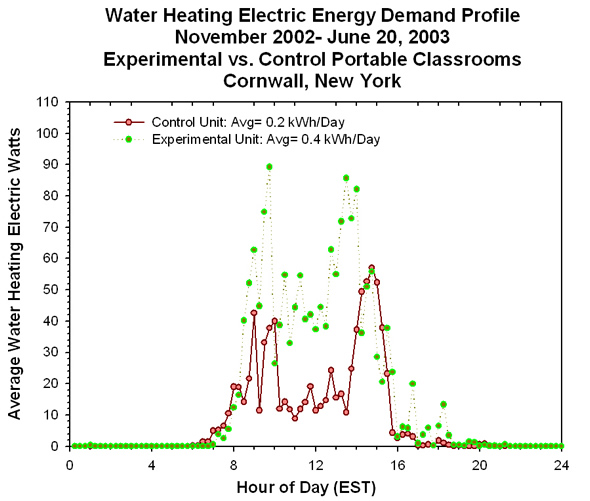
Figure 11. Average measured water heating energy use
Figure 12 shows the average plug load energy in the two portable classrooms. This is a source of bias against the energy-efficient unit since it includes a refrigerator using about 2.4 kWh per day whereas the control portable does not have a refrigerator. It is also possible to see the energy use of evening vacuuming by the janitorial staff in both units. Average plug loads are only 0.4 kWh/day in the control unit vs. 2.7 kWh/day in the improved one.
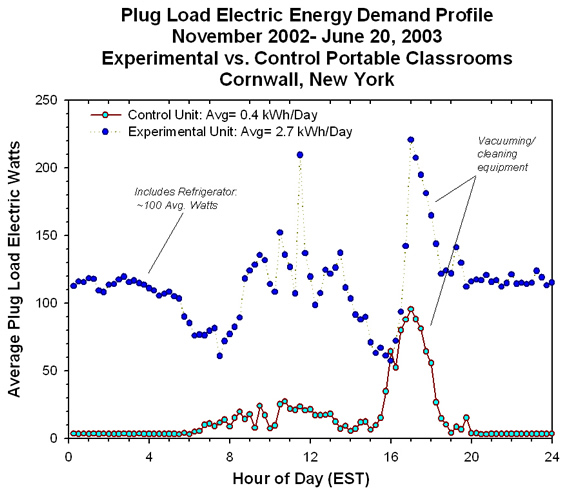
Figure 12. Average plug load energy in the two portable classrooms
© 2007-2014 University of Central Florida. The Florida Solar Energy Center (FSEC)
is a research institute of the
University of Central Florida.
For more information about FSEC, please contact us or learn more about us.
Find us on Facebook!