

![]()
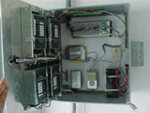
![]() Both the Base and Improved home are fully instrumented with a Campbell
Scientific CR10 data logger (see photo below) to both measure weather
and thermal conditions as well as total electrical load and to isolate
each of the major end-use loads. The data logger is connected to a AM416
multiplexer which allows the collection of a large number of analog
measurements. A SW8A pulse count board allows storage of the numerous switch-closure
measurements on site. A series of Ohio
Semitronics watt-hour transducers measure the power consumption of
the various appliances. The following electrical end-uses are individually
metered: Total electricity, Air conditioner, Air handler, Hot water, Refrigerator,
Range, Dryer, Washing Machine.
Both the Base and Improved home are fully instrumented with a Campbell
Scientific CR10 data logger (see photo below) to both measure weather
and thermal conditions as well as total electrical load and to isolate
each of the major end-use loads. The data logger is connected to a AM416
multiplexer which allows the collection of a large number of analog
measurements. A SW8A pulse count board allows storage of the numerous switch-closure
measurements on site. A series of Ohio
Semitronics watt-hour transducers measure the power consumption of
the various appliances. The following electrical end-uses are individually
metered: Total electricity, Air conditioner, Air handler, Hot water, Refrigerator,
Range, Dryer, Washing Machine.
Miscellaneous loads, including lighting and ceiling fan use are tracked
by subtracting the major electrical end uses from total.
In addition, a weather tower was installed to obtain data on ambient air
temperature, relative humidity and solar irradiance. Wind speed is
obtained by an RM Young anemometer;
solar irradiance is obtained from Li-cor
silicon cell pyranometers. Ambient and indoor relative humidities are
taken by Vaisala hygrometers. Temperatures
were taken in a variety of locations throughout both homes to characterize
thermal performance. All temperatures are taken with Type-T thermocouples
(0.1F accuracy):
- Ambient air temperature
- Attic air temperature
- Interior air temperature by thermostat
- Return air temperature (just before the coil)
- Supply air temperature (just after the coil)
- Supply air temperature at closest register
- Supply air temperature at far register
 The temperatures taken before and after the air conditioner coil allow characterization
of cooling system performance; the temperatures taken at the near and far
registers should allow assessment of heat gains to the duct systems.
The temperatures taken before and after the air conditioner coil allow characterization
of cooling system performance; the temperatures taken at the near and far
registers should allow assessment of heat gains to the duct systems.
All of the data channels in both houses are scanned every ten seconds
with integrated averages output to storage each 15-minutes. The resulting
data is then sent to FSEC over dedicated telephone lines each evening. Detailed
plots are created for each day of the monitoring project.
© 2007-2014 University of Central Florida. The Florida Solar Energy Center (FSEC)
is a research institute of the
University of Central Florida.
For more information about FSEC, please contact us or learn more about us.
Find us on Facebook!